

Centralized Monitoring of Injection Molding Machine Status and Production Data
When a production supervisor wants to check an injection molding machine's operating status, they may have to inspect each screen and then compare it with operators' notes. At shift handover, machine status, production counts, and fault information may be scattered across several places, making it hard to piece together the current situation.
Consider a typical injection molding shop. If a machine's controller exposes the required data, an industrial smart gateway can collect it and connect to a supporting cloud platform. The supervisor can then review machine status and records in an application as a starting point for checking conditions on the shop floor, rather than relying only on verbal updates.
From machine signals to a shared view
Engineers first agree with production staff on the information used every day: run signals, cumulative counts, existing alarm codes, and cycle times or temperatures exposed by the machine. Each point is associated with a machine ID, address, data type, and unit. This avoids treating molding cycles as part counts or a temperature setpoint as a measured temperature.
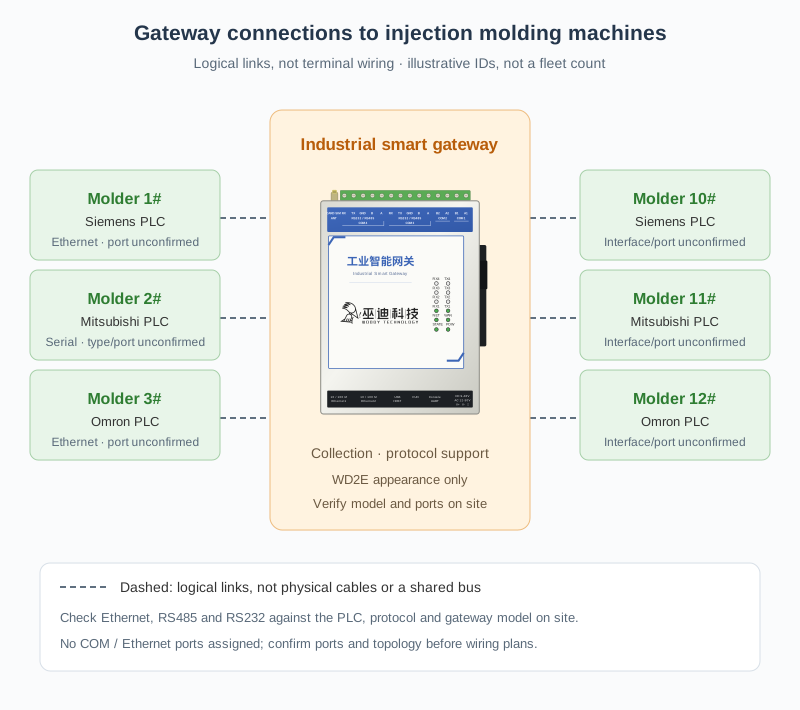
In the gateway's Web management interface, engineers configure a compatible device driver, communication parameters, and the points to read. Ethernet devices require IP and communication settings to be checked; serial devices require verification of the electrical interface and communication parameters. Readings are compared point by point with the machine display and actual operating state before the acquisition frequency is agreed. Different PLC brands can use their respective supported connection methods without replacing controllers solely for a consolidated view.
Once reading is established, this scenario uses MQTT to connect to a supporting cloud platform. Engineers configure the destination, topics, credentials, and data fields according to the platform's requirements, map machine IDs and collected values to platform records, and then configure the views.
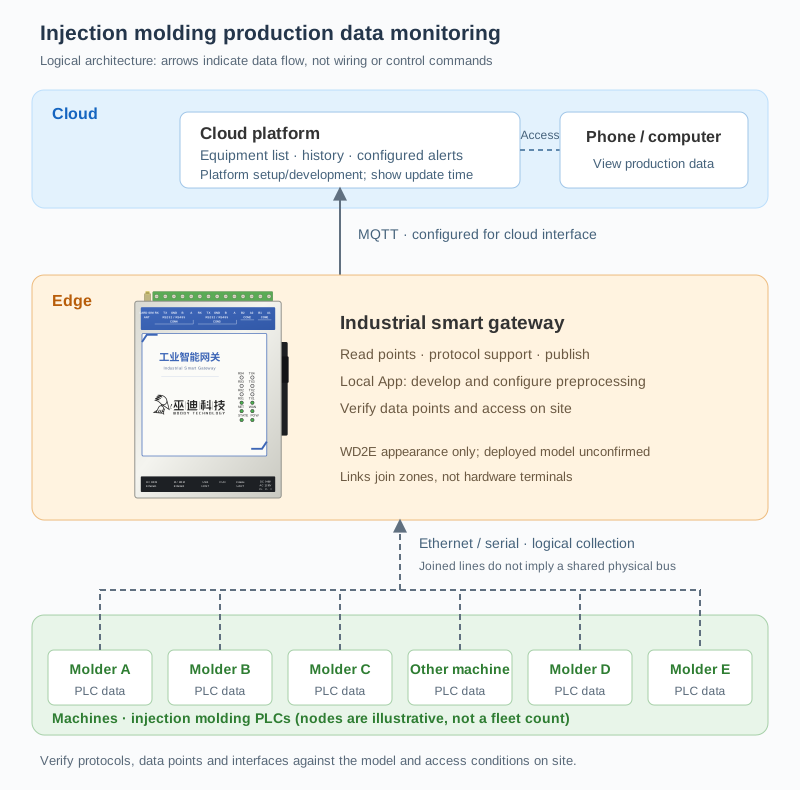
The gateway collects and publishes data; the cloud platform provides the equipment list, historical queries, and any configured alarm notifications. The views should show the last update time and flag communication loss or stale data so old values are not mistaken for current status. These views, records, and notification rules require platform functions or development and integration. Local preprocessing can be implemented through a separately developed and configured gateway App; it is not an automatic analysis function supplied by connecting a machine.
Use data to guide conversations on the shop floor
Suppose the platform shows that an injection molding machine has stopped. The supervisor can first check its status and any existing alarms at that time, then ask the shop floor whether the cause is a mold change, a material wait, or a fault. A stop signal alone cannot explain the cause: the machine must provide relevant data, or a separate recording process must be set up.
Production counts, cycle times, and temperatures can also be displayed and queried on the platform once their definitions are agreed. Calculating quality metrics or analyzing process changes requires checking the data sources and configuring rules in the supporting application. Reading data through the gateway does not automatically produce a quality assessment.
Previously, shift handover meant copying values from each machine and piecing together records taken at different times. With acquisition and views configured, the team can check the equipment list first and then verify specific questions on the floor. The shared view reduces information gathering and repeated checks; it does not replace inspections or on-site action.
Confirm before connecting
- Check the exact PLC model, supported protocol, communication interface, and read permissions. Select the gateway model for the on-site interfaces. WD2E in the diagrams is an appearance reference; the illustrated machine nodes and numbers do not represent deployment size.
- Confirm that the machine exposes the required data and agree on the meaning of counts, cycles, and temperatures. Yield rates and stop reasons need suitable source data and application rules; a run signal alone is insufficient.
- Agree on acquisition frequency and network access with maintenance staff to avoid unreasonable load on existing control communications. Check the platform's receiving interface, authentication, retention, and display rules.
This scenario reads data only, with no remote starting, stopping, or parameter writes. Shops that need a shared view of machine status, handover counts, and existing fault information can begin with the data used every day and let a supporting platform organize it into a useful viewing interface.